
The dashboard
The dashboard home
The home page answers three questions, in this order: where am I today, where am I for the month, what do I have to do now.
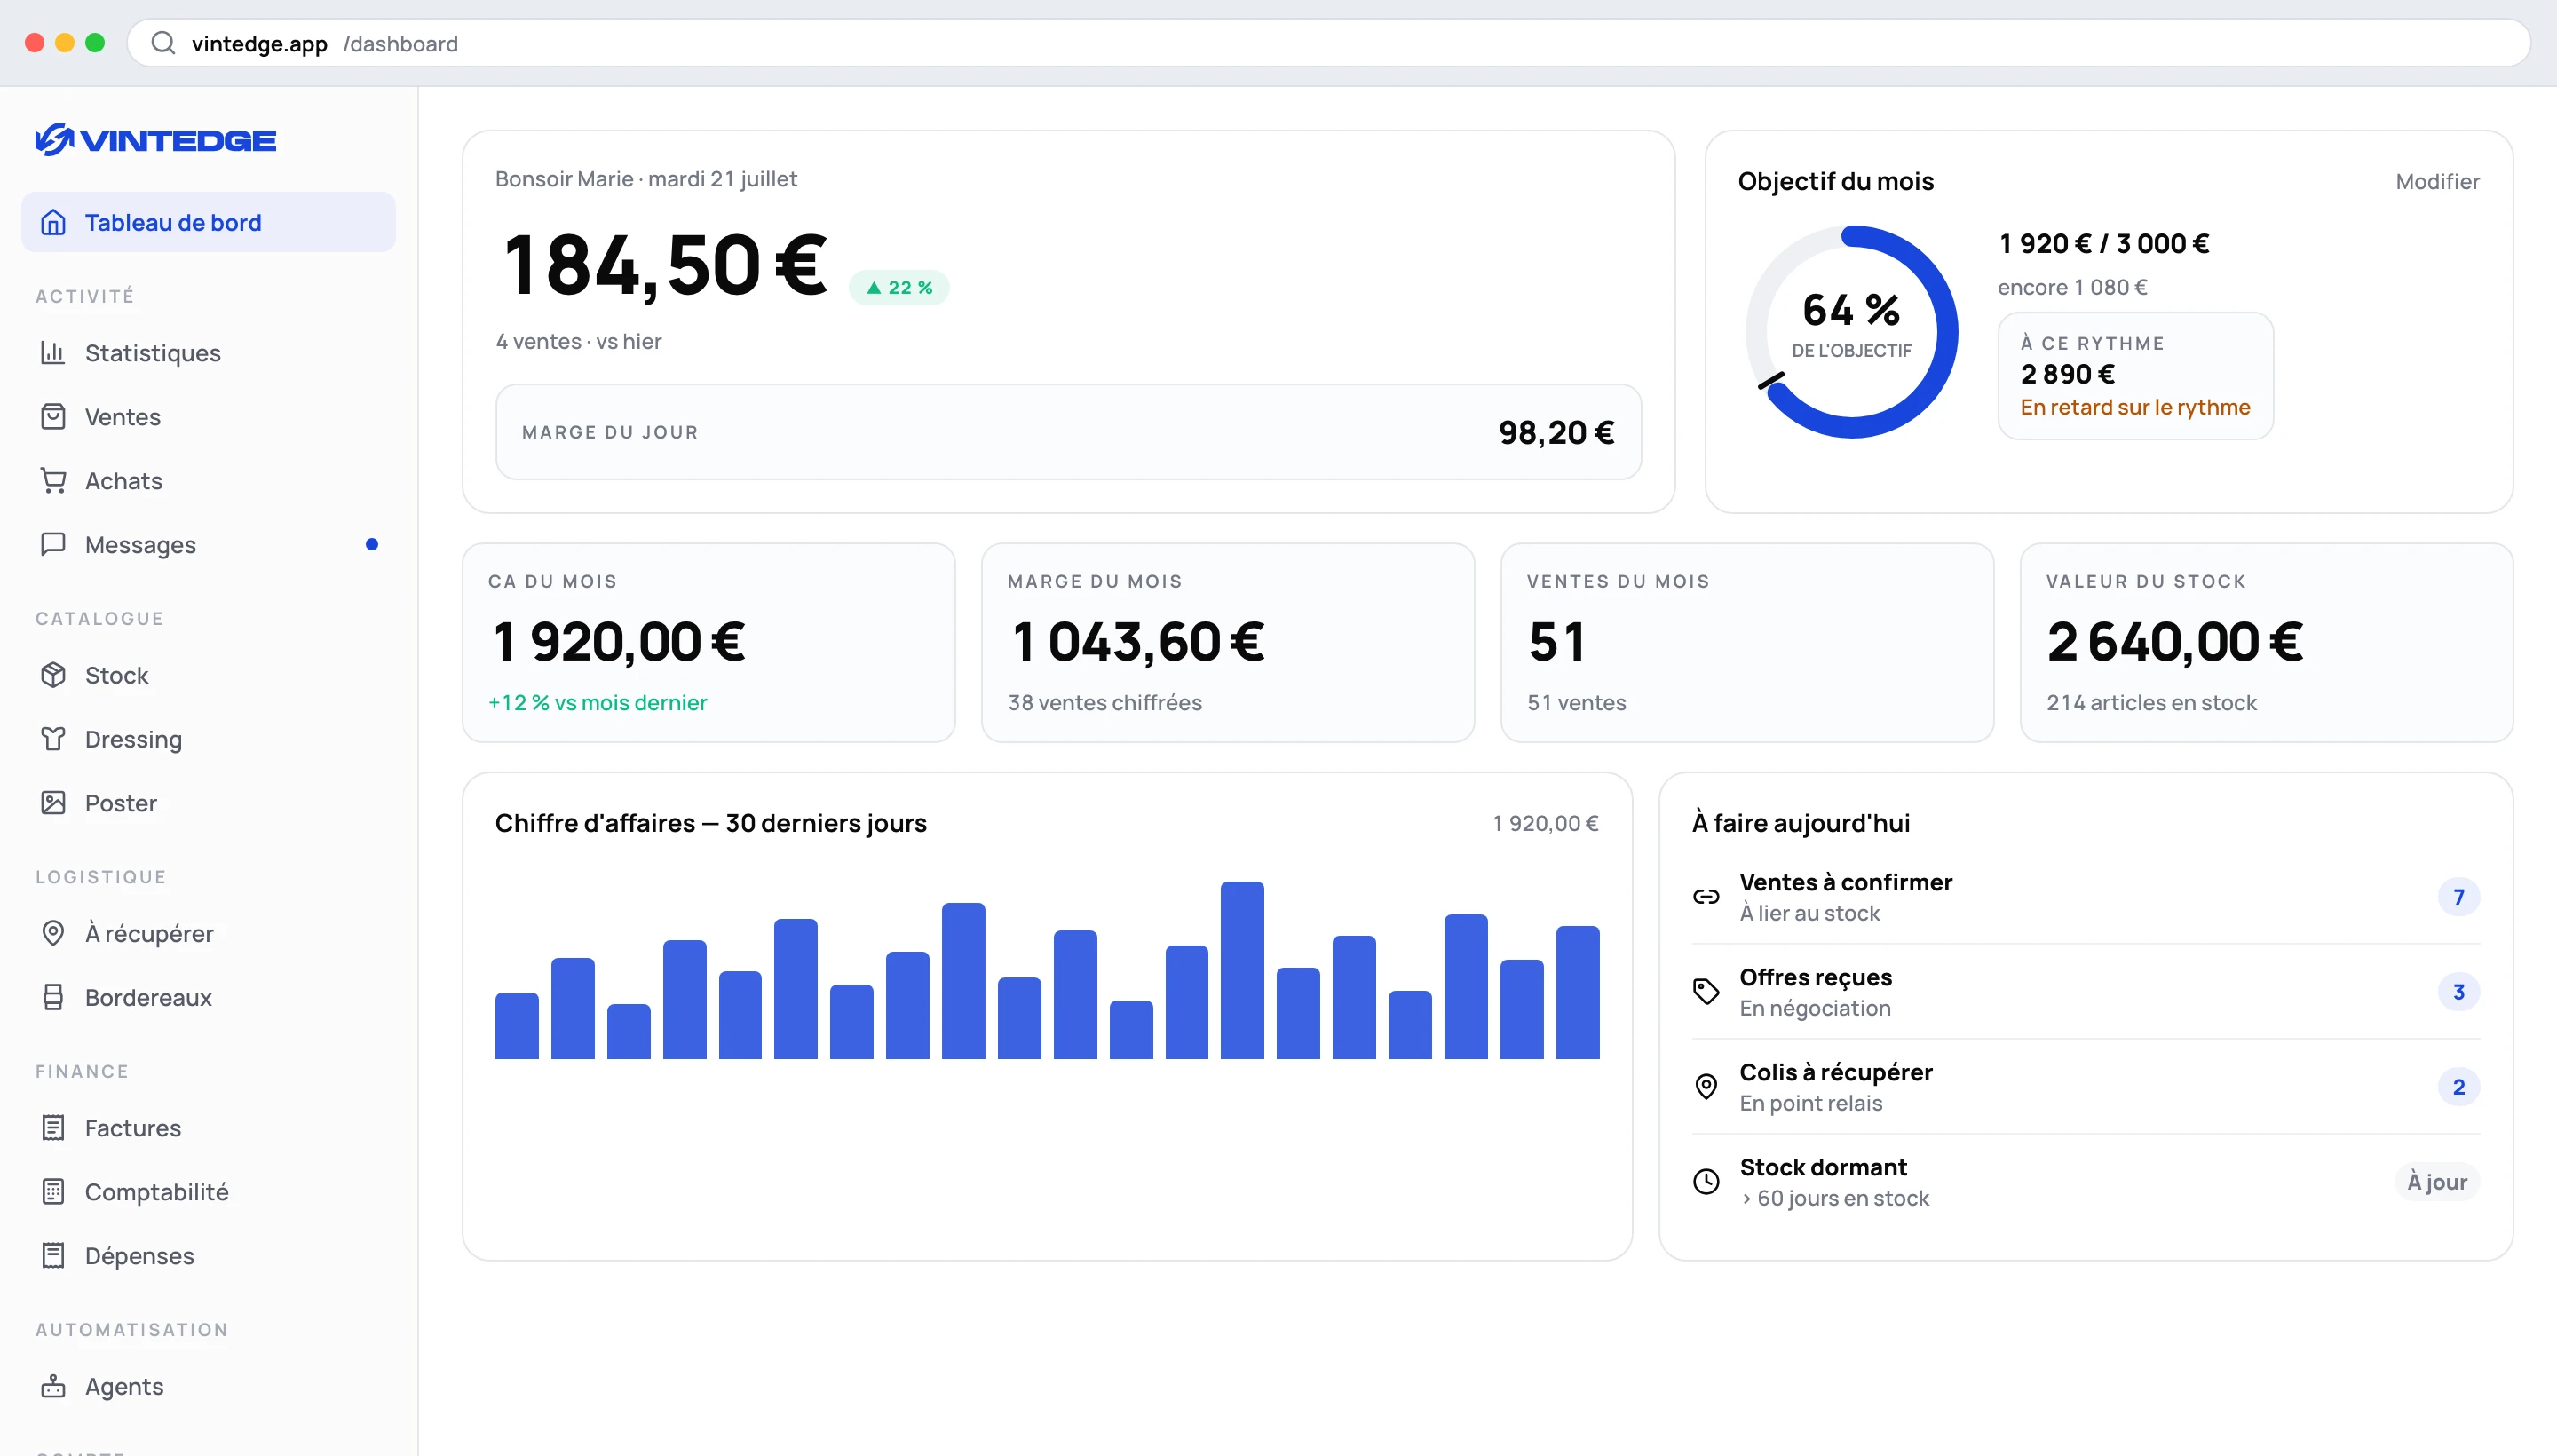
Today's figure
At the top, very large: your revenue for the day, with the number of sales and your margin.
The trend arrow compares with the same time slot yesterday, not with the whole of yesterday. At 10 a.m., comparing your morning with the entire previous day would make no sense.
If there is nothing yet, it simply shows "No sales yet today".
The four monthly indicators
- Revenue for the month — with the change compared with the previous month.
- Margin for the month — and the number of sales actually costed.
- Sales for the month — as a count.
- Stock value — what the things you have in reserve are worth.
"Costed sales" matters. The margin can only be calculated on the sales whose item has a purchase price filled in. If that counter is low, your margin is not wrong — it is simply partial. See Link your sales to your stock.
Below it, the revenue curve over 30 days.
The monthly goal
This is the most useful card on the page, and it stays empty until you set a goal. Enter an amount, confirm: the ring appears.
What it shows:
- The progress arc — the share of the goal already achieved. It turns green when the goal is reached.
- The pace marker — a small line placed at the point matching the share of the month already elapsed. That is the heart of the card: if your arc goes past the marker, you are ahead. If it falls short, you are behind.
- The projection — "At this pace", the amount you will reach by the end of the month, with the note On track or Behind pace.
The marker is calculated in fractions of a day, not whole days: on the 21st at 9 a.m., the month is at 66.5%, not 68%. On a tight goal, the difference counts.
The goal can be changed at any time with the pencil, and removed by emptying it. It is tied to no plan: you can set it even if the rest of the dashboard is locked.
To do today
Four counters, each clickable:
| Line | What it is |
|---|---|
| Sales to confirm | Sales with no stock item linked yet |
| Offers received | Negotiations in progress waiting for a decision |
| Parcels to collect | Your purchases waiting at a pickup point |
| Dormant stock | Items in stock for more than 60 days |
When all four are at zero, a green All up to date badge appears.
It is deliberately short. Four things to deal with, not fifteen.
Recent sales
Your last five sales, with thumbnail, brand, age and amount. A click opens the sale in the full list.
If the home page is empty
The cockpit hides itself silently if your plan does not give access to synced data (below Growth) or if the data has not arrived yet. The rest of the page — checklist, extension install — stays visible.
If you really are on Growth or Elite and nothing appears, check the extension indicator in the top bar: the sync may never have happened.
How the figures are calculated
Two conventions, valid across the whole dashboard:
- Earnings are the seller's, not the total paid by the buyer. Vinted adds up the item price and the buyer protection fee; that second amount does not come back to you.
- Cancelled and failed sales are excluded from every total.
These rules are the same everywhere: home, sales, analytics, profitability. The figures reconcile from one page to another.