
The dashboard
Analytics
The Analytics page is a dashboard you compose yourself.
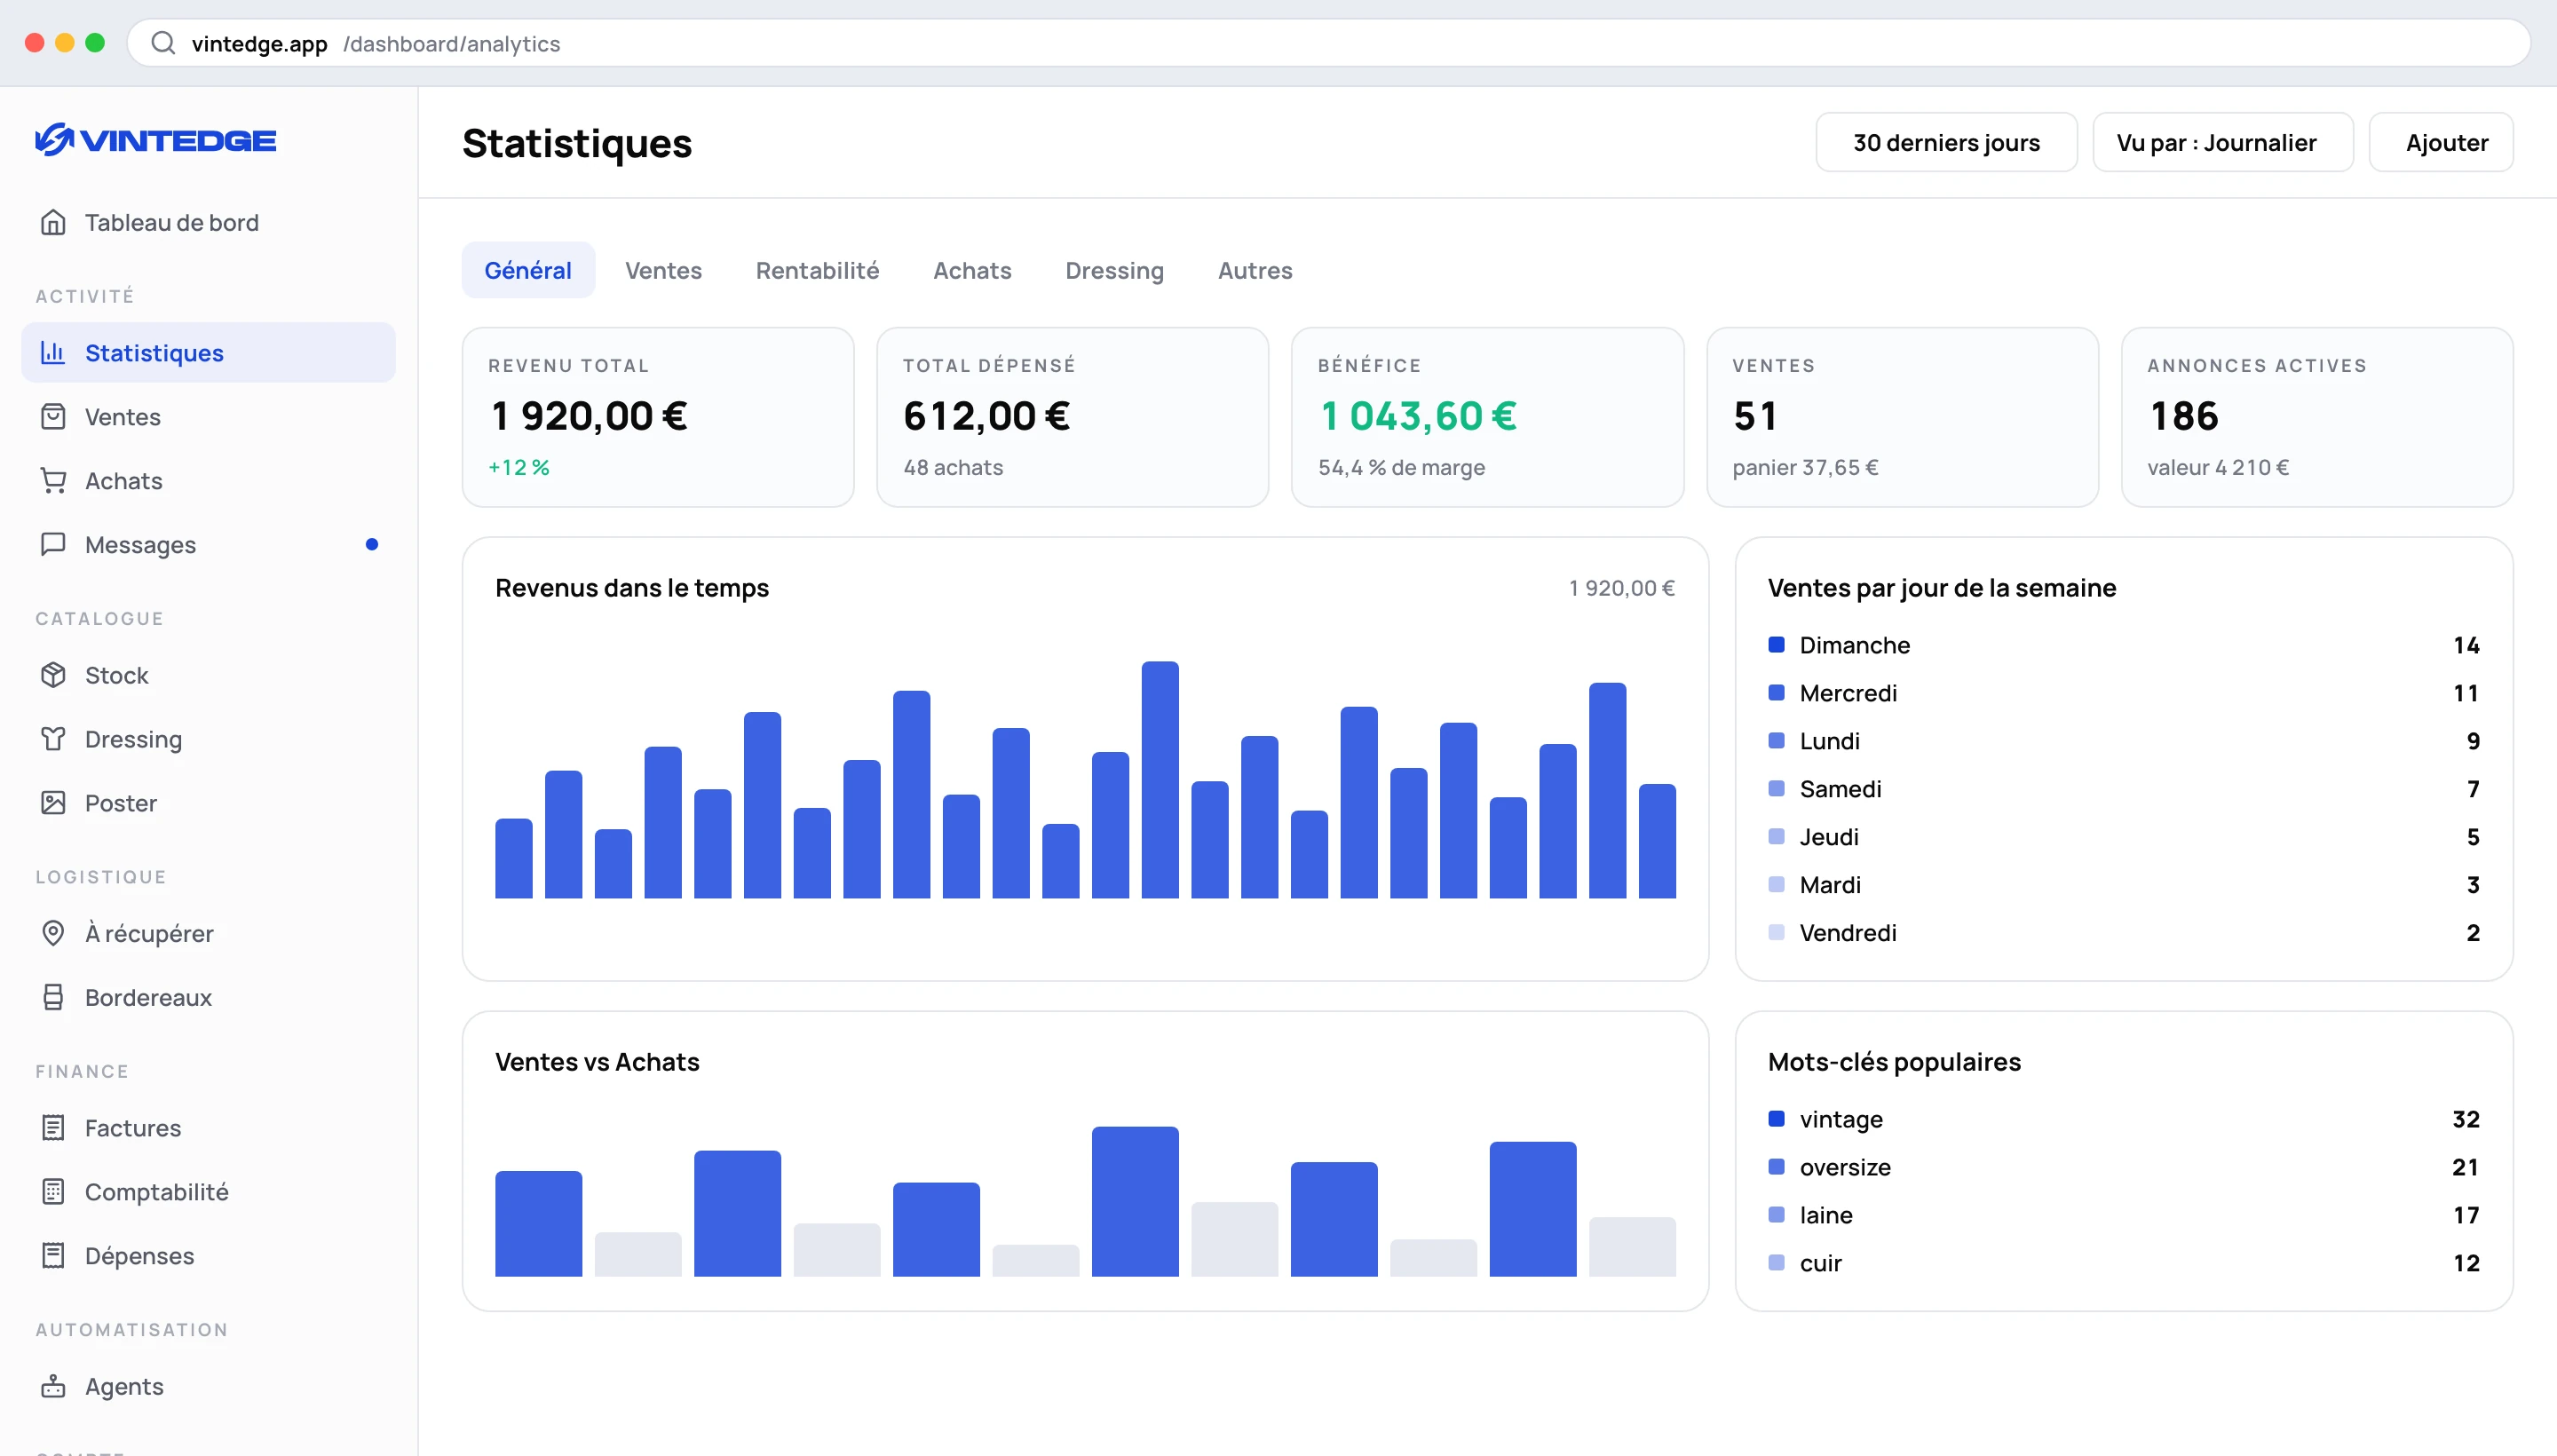
The control bar
Six tabs: General · Sales · Profitability · Purchases · Wardrobe · Others.
The period: Today · Yesterday · All · 7 days · 30 days · Last month · 3 months · 6 months · 12 months · Custom (with a range calendar).
The granularity — daily, weekly, monthly, quarterly — is derived automatically from the period you choose. You can force it, but it resets as soon as you change period: that is intended, a daily breakdown over twelve months is unreadable.
Composing your dashboard
Each tab has its indicators and its charts, and everything can be reordered by drag and drop. The Add button offers the available charts; each chart can be removed.
Your layout is remembered. Put the two or three figures you actually look at at the top.
General tab
Total revenue, total spent, profit / loss, sales, purchases, purchase/sale ratio, active listings, wardrobe value, Boost and Showcase spending.
Charts: revenue over time, sales versus purchases, and popular keywords — the words that recur in your sold listings. A blacklist lets you exclude noise words ("size", "new", "bundle"…).
Sales tab
Total earnings, sales, average selling price, completion rate, VAT commission, bundle rate.
The VAT commission is the refund of VAT on the buyer service fees, for professional accounts. That amount is already included in your total revenue. If you declare it separately, remember to deduct it.
Charts: revenue over time, sales by status, sales by day of the week, sales channel (instant buy or negotiated), buyer countries, best buyers, sales by carrier, price distribution, average price over time, top brands.
Two are worth the detour: sales by day of the week (when to publish) and sales channel (what share of your business goes through negotiation — and so how much the offer strategy earns or costs you).
Purchases tab
Total spent, purchases, average purchase price, buyer fees, returns, return rate. Charts on spending, best sellers, carriers.
The return rate per seller is a sourcing signal: a supplier whose goods you often return costs you more than their price.
Wardrobe tab
Active listings, wardrobe value, total views, total likes, average age, engagement rate (views + likes relative to the number of active items).
Charts: performance, items by brand, price distribution, views versus likes, top items by views.
The views versus likes scatter shows at a glance which items attract without convincing.
Others tab
Comparison of message templates, reply rate per template, comparison of offers. This is where you see which message converts best — the point of creating several templates with rotation.
Profitability tab
It deserves its own page: see Profitability and taxes.
A word on the period
Periods are calculated in local calendar days. "Today" starts at midnight where you are, not at midnight UTC.